Ball Possession in Football: One Statistic, Three Different Calculations
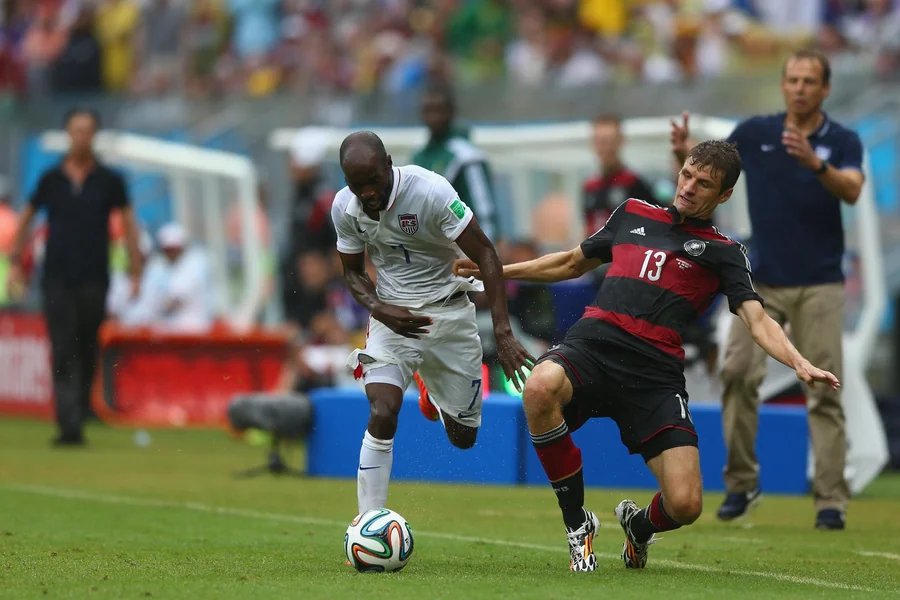
No number appears on screen more often than the possession split. Broadcasters place the figure in the corner during build-up play, half-time panels open with the figure, and post-match reports treat 65 per cent as a synonym for control. Almost nobody watching stops to ask what the percentage actually counts.
The question deserves asking, because possession in football has no single agreed definition. Three separate calculation methods have been in circulation over the past two decades, each producing a defensible answer and none producing the same answer as the others. The same fixture can therefore show 56–44 on one feed and 60–40 on another without either figure being wrong. Discrepancies of that kind matter to anyone using match statistics analytically, which is why explainers on metric definitions now sit alongside odds tables on resources listing betting apps sri lanka — a stat compared across sources needs a shared definition first.
What the Percentage Claims to Measure
Intuitively, ball possession describes the share of a match during which one side controlled the ball. The intuition is sound; the implementation is where the difficulty starts.
Two problems appear immediately. First, control is not binary. A desperate clearance hanging in the air for four seconds before dropping to an opponent sits in a grey zone that no simple clock handles well. Second, dead time distorts everything. Roughly a third of a ninety-minute fixture involves no live ball at all, so a decision must be made about whether stoppages count toward the denominator.
Different providers resolved both problems differently, and the divergence has never been reconciled.
Three Methods, Three Answers
| Method | Calculation | Period of dominance | Principal weakness |
| Chess-clock timing | Manual operator switches a three-button timer between teams and dead time | Late twentieth century to early 2000s | Dependent on operator reaction speed; the same operator often logged other events simultaneously |
| Pass-count ratio | One team’s completed passes divided by the combined total for both sides | Roughly 2000 to 2017 among major providers | Treats a five-yard square pass and a fifty-yard clearance as equivalent units |
| Possession sequences | Sequences of controlled touches are timed and aggregated; a sequence begins with a controlled touch and ends at an interception, shot, or stoppage | 2017 onward | Requires trained operators applying a judgement threshold to what counts as controlled |
The middle row explains a persistent oddity in older articles. Under the pass-count method, a side keeping the ball for long spells without passing much registered a lower share than intuition suggested, while a side recycling short passes across the back line inflated the figure without ever advancing.
The sequence-based approach, adopted by the largest provider in 2017 and now dominant in television coverage, addresses that flaw by timing controlled possession rather than counting events. Stoppages are excluded, so the denominator becomes live-ball time rather than total match time.
Why Two Screens Disagree
Feed A may apply sequence timing. Feed B may still apply an event-count ratio. A third source may use ball-contact time, counting only seconds during which a player is physically touching the ball plus a short buffer.
None of the three is fraudulent. Each answers a slightly different question, and each publishes without stating which question has been answered. Comparison across sources is therefore unreliable unless the method is confirmed first — a caution that applies equally to season-long averages, since a provider switching methodology mid-decade breaks the continuity of any historical series.
The Correlation Problem
The deeper issue concerns interpretation rather than arithmetic. Possession dominance is widely treated as evidence of superiority, yet the relationship with results is far weaker than commentary implies.
Sides built around a low defensive block surrender the ball deliberately. Conceding territory in midfield, compressing space in front of goal, and attacking through rapid transitions is a coherent strategy rather than a symptom of inferiority. Under such a plan, a possession figure of 35 per cent represents the plan working, not failing.
Game state compounds the distortion. A team leading by a goal with fifteen minutes remaining will either circulate the ball to run down the clock — inflating the share — or drop deep and defend the lead, deflating the share. Neither pattern reveals anything about the quality of the performance that produced the lead.
The blunt summary: possession describes style, not merit. High-possession sides share a tactical identity with each other, low-possession sides share a different one, and both groups contain trophy winners and relegation candidates.
Territory Rather Than Volume
Analysts responded by measuring where the ball was held rather than how long.
Field tilt, the best-known of the territorial metrics, expresses one team’s completed passes in the attacking third as a share of all final-third passes in the fixture. A side holding 35 per cent of the ball overall while registering 50 per cent field tilt is progressing quickly into dangerous areas whenever possession is regained. A side holding 65 per cent overall while registering 45 per cent field tilt is circulating the ball harmlessly in front of a compact defence.
Sterile dominance — the phrase analysts use for the second pattern — is invisible to the raw percentage and obvious in the territorial figure.
Metrics That Sit Alongside the Percentage
| Metric | What is measured | How a figure is read |
| Field tilt | Share of final-third passes belonging to one side | Higher indicates territorial dominance, independent of overall possession |
| PPDA (passes per defensive action) | Opponent passes allowed in the attacking sixty per cent of the pitch per defensive action | Lower indicates more aggressive pressing |
| Progressive passes and carries | Actions moving the ball meaningfully toward the opposition goal | Measures ball progression rather than territorial share |
| Possession value / expected threat | Probability that a possession ending at a given location produces a goal | Assigns weight to location and situation rather than duration |
| Sequence length | Number of consecutive controlled actions before a shot or loss | Distinguishes patient build-up from direct attacking |
Each metric answers a narrower question than the possession percentage attempts to answer, which is precisely the advantage. Public analytics dashboards now publish several side by side because no single figure captures control adequately.
Worth noting: territorial metrics carry limits of a similar kind. PPDA rewards sides that simply play most of a match in the opposition half, regardless of pressing intent, and field tilt says nothing about the quality of what happens in the final third.
Reading a Possession Figure Properly
Three habits make the statistic considerably more useful.
Confirm the source and the method before comparing figures drawn from different providers. Two percentages built on different definitions cannot be averaged or contrasted meaningfully.
Pair the percentage with a territorial metric. Overall possession combined with field tilt distinguishes genuine control from harmless circulation, and the pair takes seconds to read.
Account for game state. A possession split from a fixture settled after twenty minutes describes two different matches stitched together, and the aggregate figure conceals both.
Closing Perspective
Ball possession earned a permanent place on the broadcast graphic because the concept is easy to grasp and easy to display. Neither quality makes the figure a reliable measure of dominance.
Understood properly, the percentage is a fingerprint — a description of how a side prefers to play, not a verdict on how well the side played. Analytical value appears only once the calculation method is known and a territorial companion metric sits next to the number.